Visualizing Performance Data on Perfherder
Disclaimer: This content reflects my personal opinions, not those of any organizations I am or have been affiliated with. Code samples are provided for illustration purposes only, use with caution and test thoroughly before deployment.
At Mozilla, we use Perfherder to visualize our performance testing data. Perfherder is a dashboard for monitoring and analyzing performance metrics, which can include page load time, JavaScript benchmark score, build time, installer size, etc. Perfherder allow you to visualize the data as a line chart, compare performance metrics between versions and automatically create alerts for sudden change in performance metrics.
Recently I was doing page load performance testing for Servo, our goal is to test how fast Servo can load real web pages, comparing to other browser engines. I build a test runner in Python from scratch. But for the data visualization and analysis, I want to levarage existing solutions. I tried Raptor, which is a dashboard we used for the B2G OS project. It was quite neat, using a influxDB backend and Grafana frontend. But since the B2G OS project is sunsetting, the Raptor tool is no longer under active development. So I decided to use Perfherder, which is used heavily by the Platform (Gecko) team.
Basic Concepts
Before we dive into the code, we should understand some basic concepts about Perfherder in general. Perfherder is part of the Treeherder project, which is a dashboard for test results. For the Gecko project, the test results are from build jobs and test jobs running on buildbot (deprecated) and TaskCluster.
You can see the architecture of Treeherder in this diagram. It’s OK if you can’t understand everything at one glance, we won’t need to understand them all to use Perfherder. For user who wants to submit test results, there is a web API server that accepts the test result data (as JSON), and Treeherder stores it in a MySQL database. When the user opens https://treeherder.mozilla.org, the web server renders the dashboard and the Perfherder graph from the data in the database.
Treeherder/Perfherder is for build results and test results, so it introduced the concept of a Resultset. A Resultset is a container for all the build results and test results triggered by a certain GitHub pull request or Mercurial push. A Resultset should contain a revision, which is the commit SHA for the top-most commit of the push. Since a push may contain multiple commits, the rest of the commits goes into the revisions list, which we shall see in the following code examples. And you can optionally add the commit’s author, timestamp and other metadata to the Resultset.
After the Resultset was created, we can add test results to it as a Job collection. The revision in the job collection should match the one in the Resultset, otherwise the result will not be visible on Treeherder. The job collection contains metadata associated with a test, like its name, the platform it runs on and the time it takes, etc. And most importantly, the job collection can contain artifacts, which can be test result data, logs, and any other artifact the test produced. For submitting data to Perfherder, we need to provide a performance artifact, which is an artifact with a specific format that Perherder can parse. We’ll show you the format in the following example.
Treeherder provides a REST API and a python client, so you can easily submit data to it programmatically.
So to sum up, a general workflow will be:
- When someone opens a new push to the GitHub/HG repository, build and test it.
- Collect the build metadata (commit hash) and test result, format them as Resultset and performance artifacts.
- Submit the Resultset.
- Submit a Job collection containing the performance artifact to the said Resultset.
- Go to Treeherder/Perfherder to see the results.
Setting up a local Treeherder server
If you are submitting new kinds of data to Treeherder, you may want to host a Treeherder server on your own computer for testing. If you already have access to the stage or production server, you can skip this section.
Treeherder is open source (of course), and it provides a Vagrant configuration for you to install it effortlessly. There is an excellent documentation you can follow, so we won’t go into detail in this post.
After you installed the server as a Vagrant virtual machine (VM), you need to generate an API credential so you can push data to it through the Python client. After you are confident in your data submission process, you can request for access to the stage or production server. Notice that before you generate the credential, you should at least login to your Treeherder server once from the Web UI, otherwise the create credential script will complain that the user does not exist.
If you want to create a new repository on Treeherder, just like we do for Servo, you can follow these instructions.
Installing the Treeherder Client
Installing the Python client is easy. If you use virtualenv, you can simply run:
virtualenv venv
source venv/bin/activate
pip install treeherder-client
Then, you can import thclient in your python script to use it. It provides endpoints for Resultset and Job collections. You can read more in the official documentation, but be warned, the example code has errors. We’ll show you a modified example instead.
Submitting a Resultset
First, we need to submit our build metadata as a Resultset. The code we use for production can be found here.
The data should look like this:
dataset = [
            {
                # The top-most revision in the list of commits for a push.
                'revision': 'ab12d8098fcc0517b64643d25683e2e15e665410', # Commit hash

                'author': 'bos-servo <bors@allizom.com>', # Commit author

                'push_timestamp': 1462525798, # Unix epoch time

                'type': 'push',

                # a list of revisions associated with the resultset. There should be
                # at least one.
                'revisions': [
                    {
                        'comment': 'Auto merge of #11033 - mbrubeck:max-log, r=metajack'
                        'revision': 'ab12d8098fcc0517b64643d25683e2e15e665410', # Commit hash
                        'author': 'bos-servo <bors@allizom.com>', # Commit author
                        'repository': 'servo',
                    }
                ]
            }
        ]
Then, we fill in the data into a Resultset object for submission:
dataset = [
from thclient import (TreeherderClient, TreeherderResultSetCollection)

# Create a Resultset collection
trsc = TreeherderResultSetCollection()

# Fill-in the fields
for data in dataset:

    # Get a Resultset instance
    trs = trsc.get_resultset()

    trs.add_push_timestamp(data['push_timestamp'])
    trs.add_revision(data['revision'])
    trs.add_author(data['author'])
    # trs.add_type(data['type']) # Optional

    revisions = []
    for rev in data['revisions']:

        tr = trs.get_revision()

        tr.add_revision(rev['revision'])
        tr.add_author(rev['author'])
        tr.add_comment(rev['comment'])
        tr.add_repository(rev['repository'])

        revisions.append(tr)

    trs.add_revisions(revisions)

    trsc.add(trs)
Finally, we create a Treeherder client and submit the data (through an HTTP(S) POST request):
dataset = [
# Use the client id and secure you created before.
client = TreeherderClient(protocol='https', # Use 'http' if running locally
host='local.treeherder.mozilla.org',
client_id='servo',
secret='xxxxxxxxxxxxxxxx')
project_name = 'servo'
# data structure validation is automatically performed here, if validation
# fails a TreeherderClientError is raised
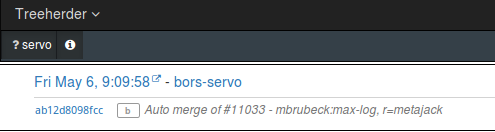
client.post_collection(project_name, trsc)This is how it looks like on Treeherder:
If you use a GitHub webhook, you should be able to get the commit metadata directly. But if you are running the build and test locally, you can use this script to dump the latest commit as JSON, so your Python script can load it with
json.load().
Submitting a Performance Artifact
After the Resultset was created, we can submit a Job collection containing the performance artifact:
dataset = [
{
'project': 'servo',
'revision': 'ab12d8098fcc0517b64643d25683e2e15e665410', # Commit hash
'job': {
'job_guid': job_guid, # This is a job ID from your test runner, use it to identify the test.
'product_name': 'servo',
'reason': 'scheduler',
'who': 'Servo',
'desc': 'Servo Page Load Time Tests', # Test description
'name': 'Servo Page Load Time', # Test name
# The symbol representing the job displayed in
# treeherder.allizom.org
'job_symbol': 'PL',
# The symbol representing the job group
'group_symbol': 'SP',
'group_name': 'Servo Perf',
# If your test runner tracks the start and end time, you can submit it here
'submit_timestamp': 1462525798,
'start_timestamp': 1462525798,
'end_timestamp': 1462525798,
# You can submit states like 'pending' so user can see the status of the test
'state': 'completed',
'result': 'success',
'machine': 'local-machine',
'build_platform': {
'platform': 'linux64',
'os_name': 'linux',
'architecture': 'x86_64'
},
'machine_platform': {
'platform': 'linux64',
'os_name': 'linux',
'architecture': 'x86_64'
},
'option_collection': {'opt': True},
# jobs can belong to different tiers
# setting the tier here will determine which tier the job
# belongs to. However, if a job is set as Tier of 1, but
# belongs to the Tier 2 profile on the server, it will still
# be saved as Tier 2.
'tier': 1,
# the ``name`` of the log can be the default of "buildbot_text"
# however, you can use a custom name. See below.
# You can upload your test log to some public URL and point to it
'log_references': [
{
'url': 'TBD',
'name': 'test log'
}
],
# The artifact can contain any kind of structured data
# associated with a test.
'artifacts': [
{
'type': 'json',
'name': 'performance_data',
# 'job_guid': job_guid,
'blob': perf_data # Will be covered later
},
{
'type': 'json',
'name': 'Job Info',
#'job_guid': job_guid,
"blob": {
"job_details": [
{
"url": "https://www.github.com/servo/servo",
"value": "website",
"content_type": "link",
"title": "Source code"
}
]
}
}
],
# List of job guids that were coalesced to this job
'coalesced': []
}
}
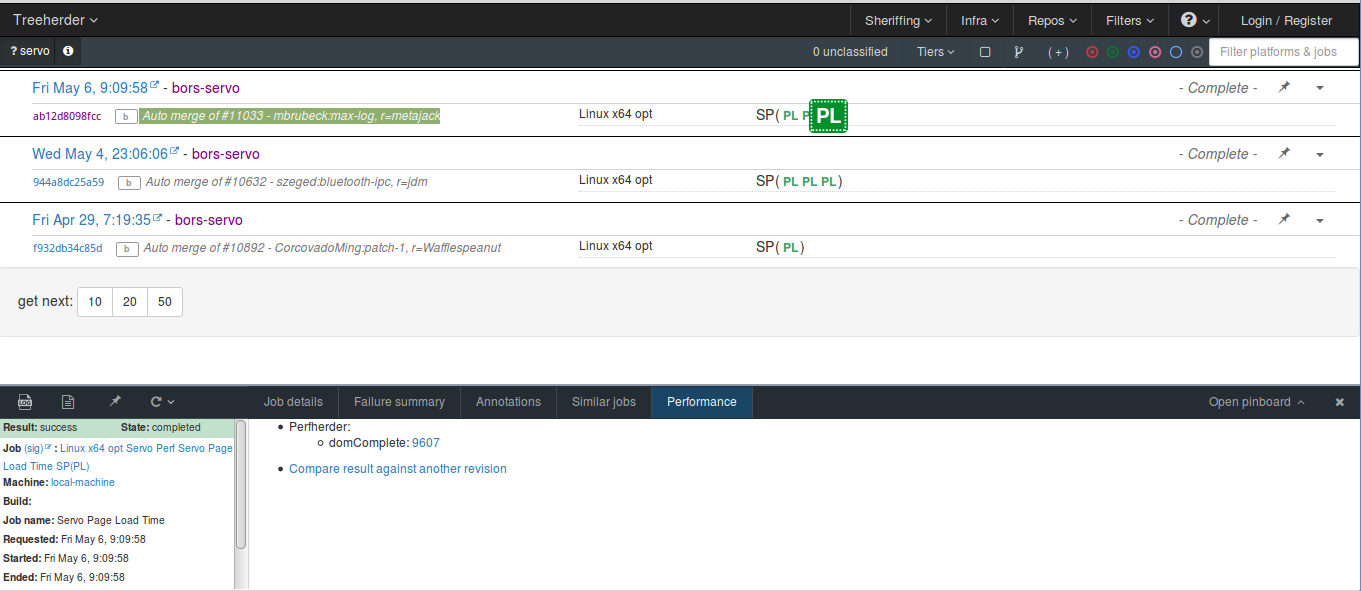
]After you submit this data (see the submission code below), you’ll see a test result marked as PL in the SP group:
In the data, notice that we didn’t define the job_guid, this it whatever unique ID you used in your test runner to identify a test. We didn’t have this in our simple test runner, so we just randomly generate a string for it.
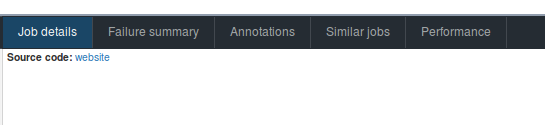
In the artifacts section, we submitted two types of artifacts, first is the performance artifact, which we’ll explain right away. The second is a job_details artifact, which will show up in the Treeherder UI like so:
The performance artifact perf_data should look like this:
dataset = [
"performance_data": {
    # You need to mark the framework as "talos" so
    # Treeherder will generate a "Performance" tab
    "framework": {"name": "talos"},
        "suites": [
        {
            "name": "domComplete",
            "value": 3741.657386773941,
            "subtests": [
                {"name": "about:blank", "value": 1000},
                {"name": "163.com", "value": 14000},
            ]
        }
    ]
}
Here we submit the domComplete time for loading the pages. The value is a geometric mean of all the subtests’ domComplete time. You can use other ways to summarize the results from all the subtests. Be careful not to submit data that is over 80 characters long, Threeherder has an undocumented limit for that.
, the Treeherder UI will generate a “Performance” tab for us, from which you can find the link to the Perfherder view.
Edit: If you have a new perofrmance test framework, and want Treeherder to generate the “Performance” tab for you, you should open a bug for that. Here is an example. After you add your framework to treehderder/model/fixtures/performance_framework.json, you can use "framework": {"name": "your_framwork_name"} in your performance artifact.
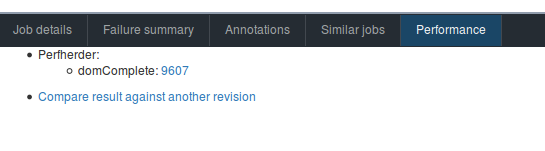
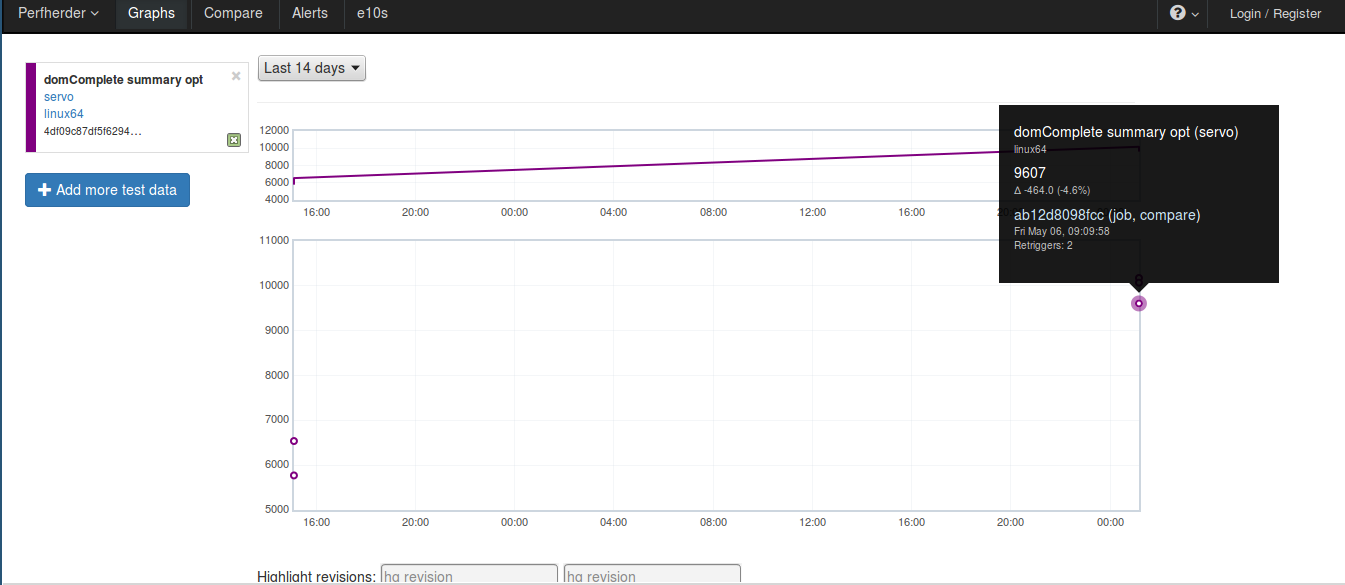
By clicking on the test result number 9607, you’ll be directed to the graph:
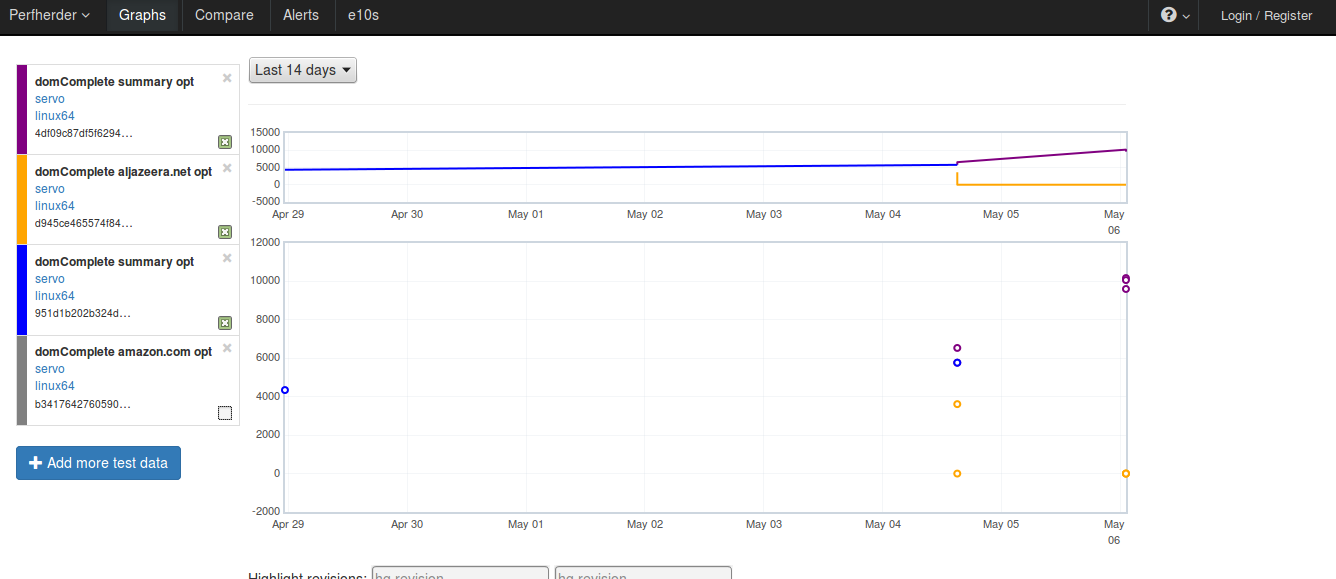
If you click on the “+ Add more test data” button, you can choose to show all subtest data:
And this is the code for actually submitting the data to Treeherder; we leave it to the end because it’s similar to the previous one. This is of course a simplified version, to see the real code I run in production, check here.
dataset = [
tjc = TreeherderJobCollection()

for data in dataset:

    tj = tjc.get_job()

    tj.add_revision(data['revision'])
    tj.add_project(data['project'])
    tj.add_coalesced_guid(data['job']['coalesced'])
    tj.add_job_guid(data['job']['job_guid'])
    tj.add_job_name(data['job']['name'])
    tj.add_job_symbol(data['job']['job_symbol'])
    tj.add_group_name(data['job']['group_name'])
    tj.add_group_symbol(data['job']['group_symbol'])
    tj.add_description(data['job']['desc'])
    tj.add_product_name(data['job']['product_name'])
    tj.add_state(data['job']['state'])
    tj.add_result(data['job']['result'])
    tj.add_reason(data['job']['reason'])
    tj.add_who(data['job']['who'])
    tj.add_tier(data['job']['tier'])
    tj.add_submit_timestamp(data['job']['submit_timestamp'])
    tj.add_start_timestamp(data['job']['start_timestamp'])
    tj.add_end_timestamp(data['job']['end_timestamp'])
    tj.add_machine(data['job']['machine'])

    tj.add_build_info(
        data['job']['build_platform']['os_name'],
        data['job']['build_platform']['platform'],
        data['job']['build_platform']['architecture']
    )

    tj.add_machine_info(
        data['job']['machine_platform']['os_name'],
        data['job']['machine_platform']['platform'],
        data['job']['machine_platform']['architecture']
    )

    tj.add_option_collection(data['job']['option_collection'])

    # for log_reference in data['job']['log_references']:
    #    tj.add_log_reference( 'buildbot_text', log_reference['url'])

    # data['artifact'] is a list of artifacts
    for artifact_data in data['job']['artifacts']:
        tj.add_artifact(
            artifact_data['name'],
            artifact_data['type'],
            artifact_data['blob']
        )
    tjc.add(tj)

client.post_collection(project_name, tjc)
It’s Your Turn
This is how easy it is to submit data to Perfherder. If you have any project relevant to Mozilla, and want to show your data on Perfherder, you can request for access to the stage or production server. Since everything is open source, you can also consider hosting your own Treeherder/Perfherder instance. If you are interested in Treeherder and Perfherder, you can read their official documentation, report issues, or contribute code to their GitHub repository.
If you are interested in Servo’s performance testing, you can follow this GitHub Issue. Submit issues and contribute pull requests in the servo-perf repository. (Although we might soon merge the code back to the Servo main repository.)
Special thanks for William Lachance for teaching me how to use Perfherder and opening accounts for me.